Olson Technology LP-OA User Manual
Page 6

025-370571 X2
www.olsontech.com
6
Performance Graphs
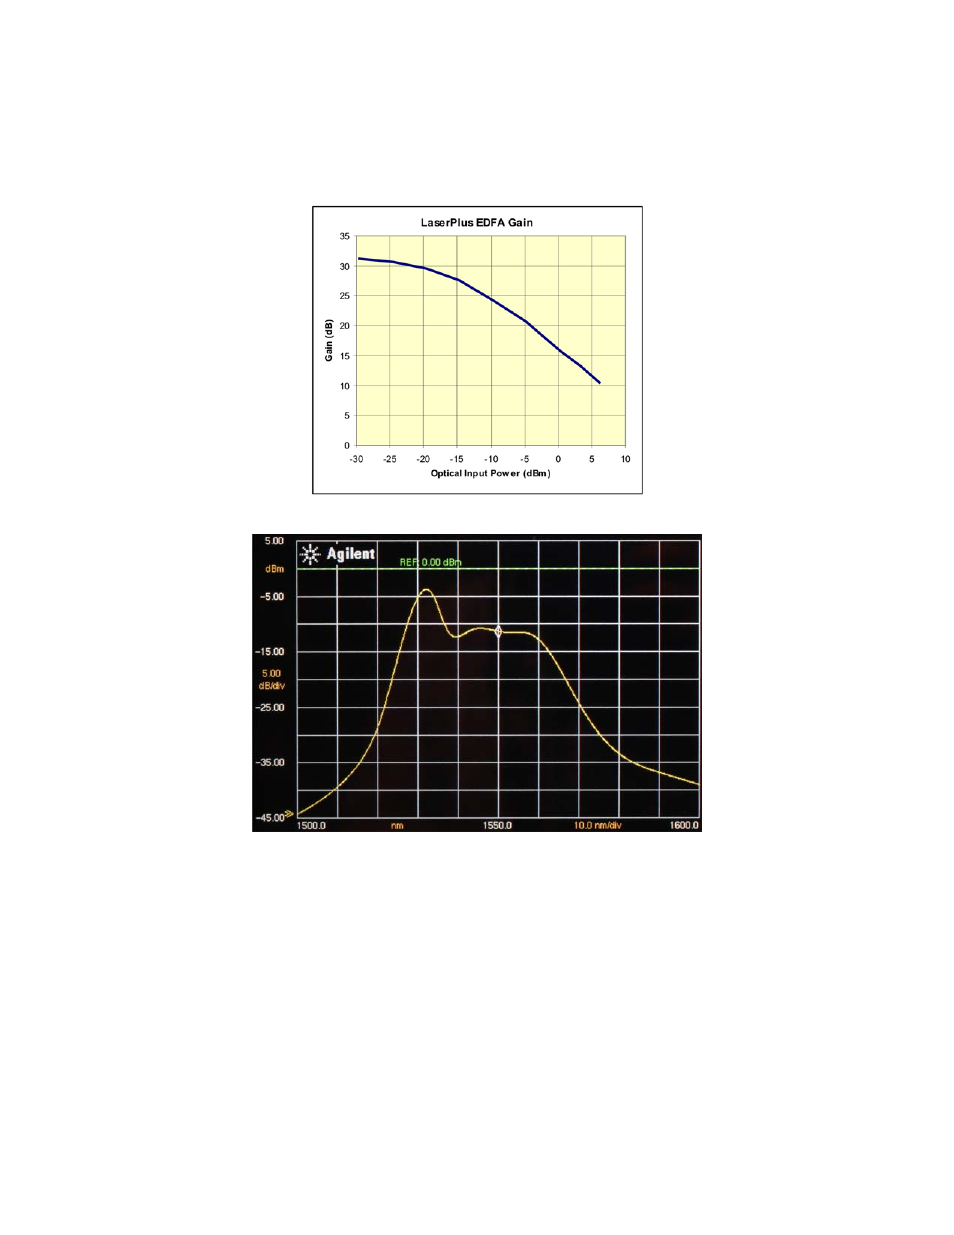
Figure 3 shows the typical gain of the LP-OA EDFA. It is easiest to understand the operation of an EDFA once you realize
that they are saturated output power devices. In other words, they tend to put out full power regardless of what the input
conditions are. This makes the gain of the EDFA’s versus the optical input power look very odd. Figure 3 shows the typical
behavior of a +17dBm optical output power EDFA. Figure 3 suggests that the gain of the EDFA drops as the optical input
power is increased. In fact, for optical inputs above about -10dBm, the optical output power is a constant +17dBm.
Figure 3 — Typical EDFA Gain
Figure 4 — Typical EDFA ASE Spectrum
See also other documents in the category Olson Technology TV Accessories:
- 6920-RT-x (7 pages)
- LLRX-400 (Arris) (6 pages)
- 7-OR (10 pages)
- SA6940-RT (8 pages)
- DSK-300-S (9 pages)
- FRMUC-AR440 (7 pages)
- LLRX-200 (Arris) (7 pages)
- DSK-550 (11 pages)
- FRMUC-T-6940 (7 pages)
- NTM342x (5 pages)
- ISX-3040 (6 pages)
- LCD-550x1 (13 pages)
- LCM-300-S (10 pages)
- LCM-500-550-BG (6 pages)
- LCM-500-550 (5 pages)
- LCM-550x1 (FAC) (3 pages)
- LCM-550x1 (PAL B/G) (4 pages)
- LCM-500-550-DF (6 pages)
- LCM-550x1 (PAL I) (4 pages)
- LCM-550x1 (11 pages)
- LCM-600 (6 pages)
- LCM-6550 (6 pages)
- LCx12-AMP (3 pages)
- LCM-750x3 (8 pages)
- LCP-500-550 (10 pages)
- LP-PS-X (11 pages)
- LP-DC-X (10 pages)
- LP-OT-RCxx (7 pages)
- LP-OR-304 (10 pages)
- LP-penis (21 pages)
- OLMT (9 pages)
- OLRT (8 pages)
- Penis (27 pages)
- OTA-1000 (5 pages)
- OT-1000-HH Rev.X4 (20 pages)
- OTD-3000-BG (8 pages)
- OTD-3000 (12 pages)
- OTM-3000 (PAL D) (7 pages)
- OT-1000-HH Rev.X2 (24 pages)
- OTDC-440-X (2 pages)
- OT-DCM-F (6 pages)
- OTD-3000-I (9 pages)
- OTDL-FOM-01 (6 pages)
- LCM-550x1-Series (50 pages)
