Dispersion characteristics, Technical specifications – d&b 10AL User Manual
Page 9

2.4. Dispersion characteristics
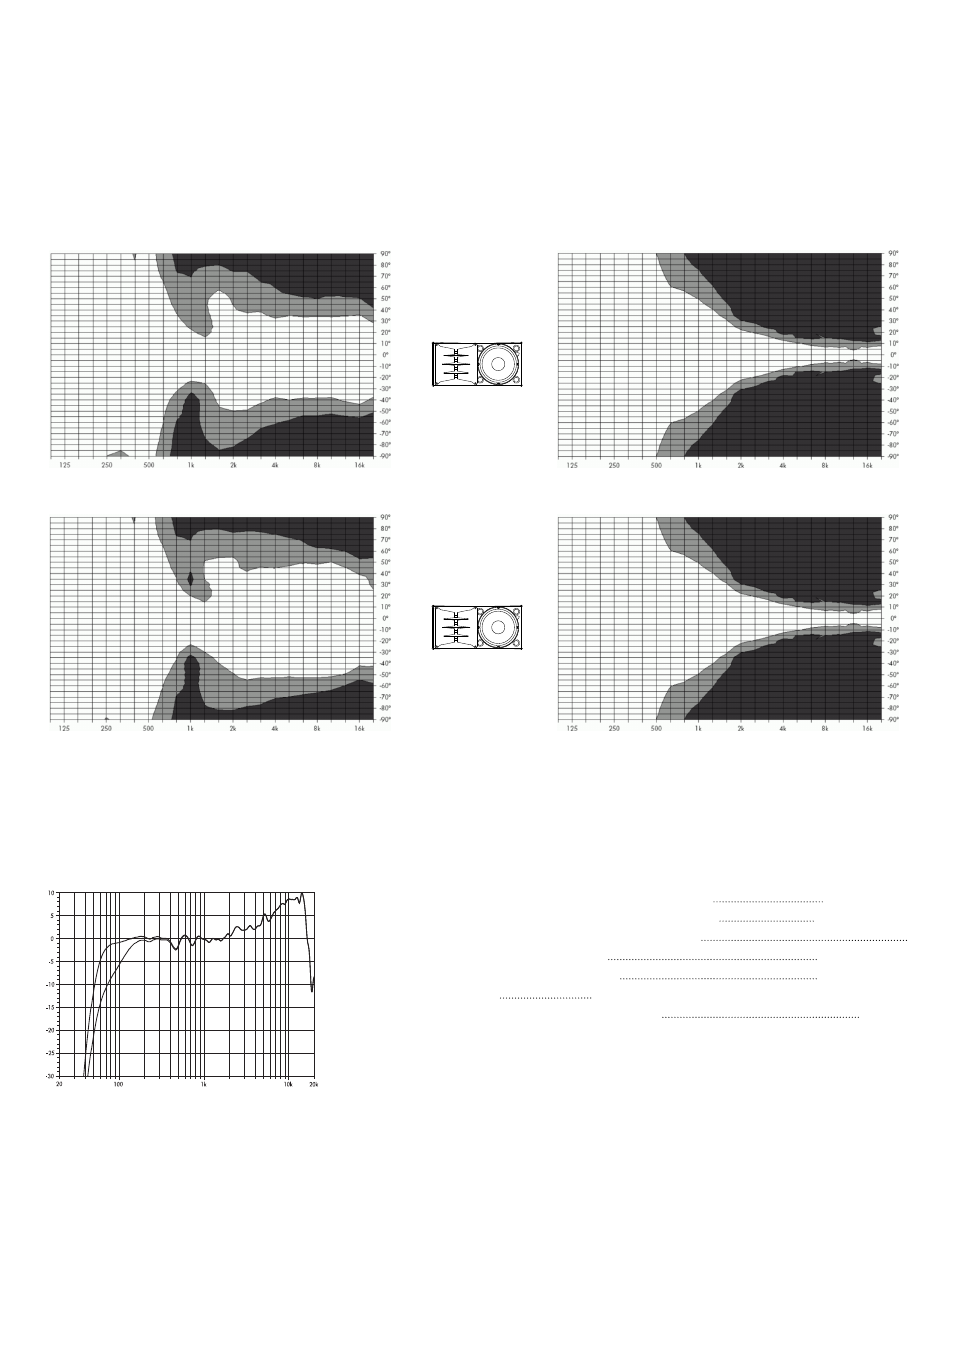
The following graphs show dispersion angle over frequency of a
single cabinet plotted using lines of equal sound pressure (isobars)
at –6 dB and –12 dB.
Fig. 8: Isobar diagram horizontal
10AL
Fig. 9: Isobar diagram vertical
Fig. 10: Isobar diagram horizontal
10AL-D
Fig. 11: Isobar diagram vertical
2.5. Technical specifications
10AL/10AL-D system data
Frequency response (–5 dB standard)
60 Hz - 18 kHz
Frequency response (–5 dB CUT mode)
110 Hz - 18 kHz
Max. sound pressure 1 m, free field)
10AL with D6/D12
130 dB/133 dB
10AL-D with D6/D12
129 dB/132 dB
(SPLmax peak, pink noise test signal with crest factor of 4)
Input level (100 dB-SPL/1 m)
–16 dBu
Fig. 12: 10AL frequency response, standard and CUT modes
d&b 10AL/10AL-D Manual (1.2 EN)
9
