Altec Lansing 938-8AE User Manual
Page 4
Attention! The text in this document has been recognized automatically. To view the original document, you can use the "Original mode".
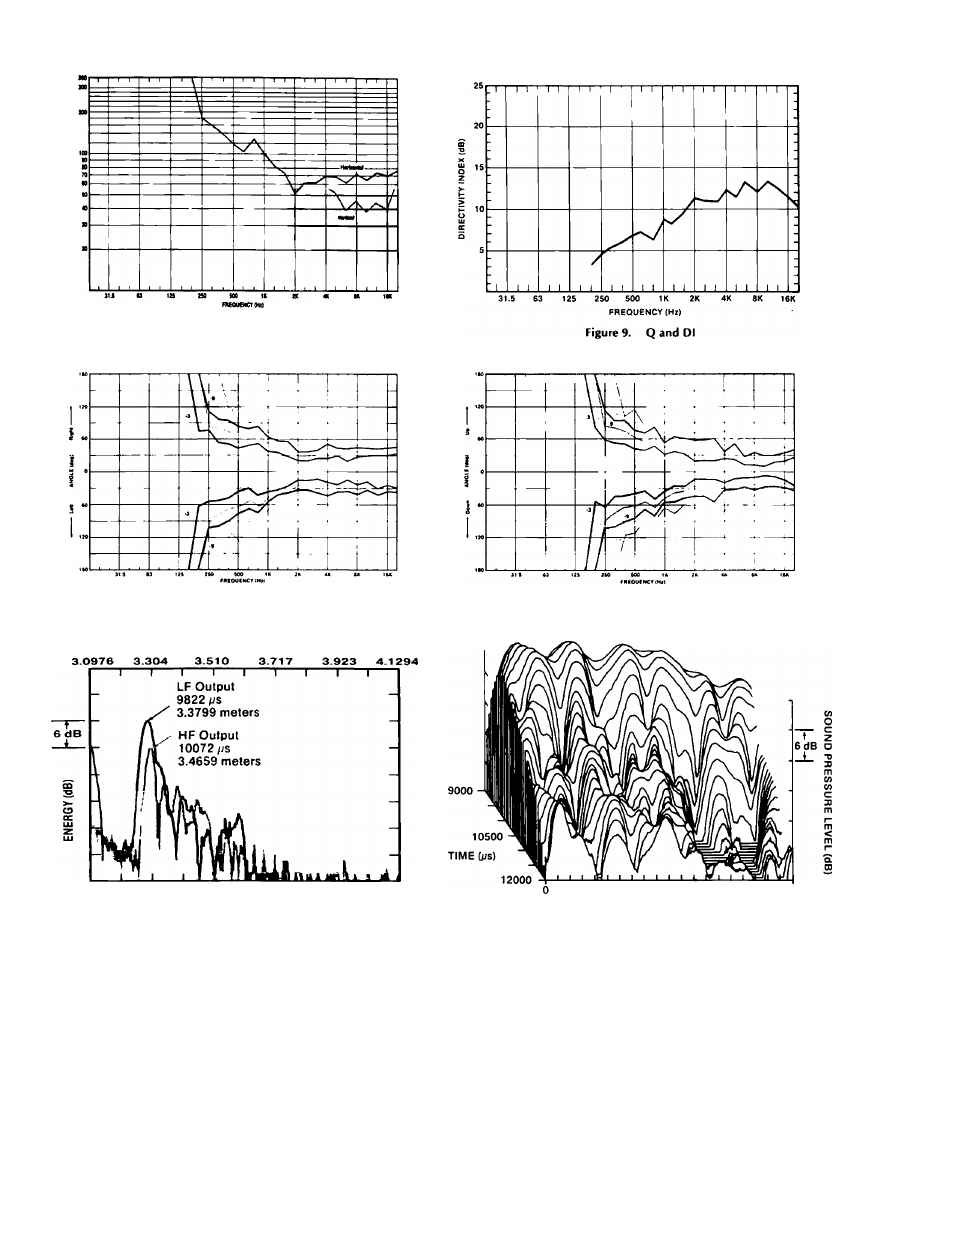
Figure 8. Coverage Angle
Figure 10. Florizontal Off-Axis Response Contours
Figure 11. Vertical Off-Axis Response Contours
DISTANCE (m]
9000
9600
10200
10800
11400
12000
TIME (ps)
Figure 12. Energy Time Curve (See Note 9)
5K
10K
15K
20K
FREQUENCY (Hz)
Figure 13. Time Energy Frequency Curve (See Note 10)
NOTES ON MEASUREMENT CONDITIONS
1. Figure 1 measurement was taken with network attenuation set in
the "Fiat" position.
2. Pink noise signai, one watt caicuiated using EVZmin. 3.16 meter
measurement distance referred to one meter.
3. On-axis, one watt caicuiated using EVZmin, 3.16 meter. Measure
ment distance referred to one meter, iow frequencies corrected
for anechoic chamber error.
4. This system rating patterned after the AES method for individuai
drivers, where the test signai is pink noise with 6 dB crest factor
over the bandwidth of the system, with power caicuiated using
EVZmin, for two hours.
5. This measurement made under the same conditions as Pressure
Sensitivity, but at rated power, and takes into account any power
compression effects due to non-iinearities in the system.
6. Phase response of the system measured at a time corresponding
to the energy arrival of the high frequency component, as noted
on Figure 12.
7. Distortion components invalid above 10 kHz The percentage
distortion at any given frequency may be found by graphically
taking the difference between the fundamental and harmonic, chanfiC/20 8. The axis of rotation for all polar plots is the apparent apex of the high frequency horn. Plots below 200 Hz have not been shown 9. The time window has been chosen to resolve the arrival times of low and high frequency components. Frequency bandwidth of 10. Response decay of the system. Time window is the same as used in Figure 12, Energy Time Curye. 11. The loudspeaker system should be connected to the eight ohm tap of amplifiers using transformer coupled output sections. 12. Continuous program is defined as 3 dB greater than the AES rating using a pink noise signal with 6 dB crest factor. 13. Peak power is defined as 6 dB greater than the AES rating using a pink noise signal with 6 dB crest factor.
adding 18 dB, and applying the formula: percentage distortion =
lOOx 10.-<
because of their lack of pertinent information.
measurement, 800 Hz-2.8 kHz