SUUNTO t3 User Manual
Page 21
Suunto t3 shows the Training Effect in two ways. The lower right side of the display shows it as a
graph. It is so shown as a number in the center of the screen instead of the heart rate reading.
The TE of each workout is defined by the highest number (from 1.1 to 5.0) reached during the
workout. The peak TE reached stays visible on the graph. If you want to further increase the effect
after a lower intensity period, you need to work-out harder to push the peak higher.
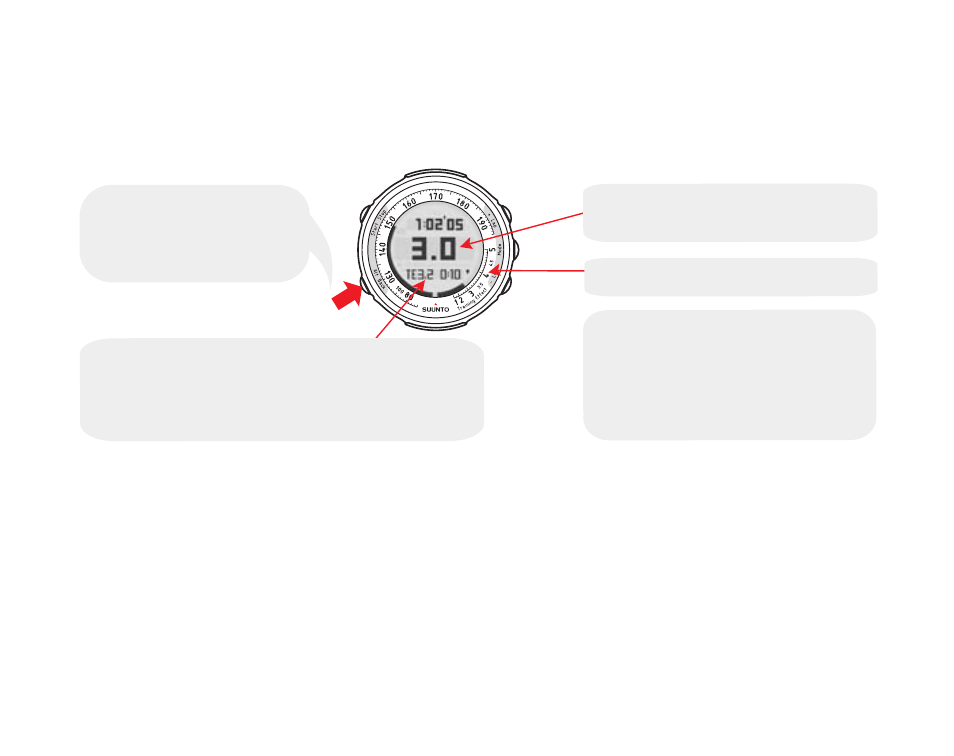
Long pressing the BACK
button switches between
heart rate and real-time
Training Effect.
2 sec
TE can be shown in the center
instead of heart rate.
TE graph + scale
If you continue your workout after
reaching the target, the bottom row
automatically starts showing
remaining time to the next TE level,
in this case 3.4.
This shortcut shows how much time you still have
to the next training effect level. In this example,
you need to continue 10 minutes at the current
intensity to reach TE 3.2.
NOTE
When you have reached your targeted Training Effect, the Suunto t3 dis-
plays "TE reached" temporarily on the screen and you will hear a beep.
19