Vernier Optics Expansion Kit User Manual
Page 2
3
Sample Experiments: Real Image Formation
The thin lens equation is
o
i
f
1
1
1
where f is the lens focal length, i is the image to lens distance, and o is the object to
lens distance. Sign convention for f is positive for converging lenses, negative for
diverging. The variable i is positive if the (real) image is in back of the lens, and
negative if the (virtual) image is in front. The variable o is positive if the (real) object
is in front of the lens, and negative if the (virtual) object is behind the lens.
This relationship can be verified using the Optics
Expansion Kit. Place the light source near the end
of the track, with the luminous source facing along
the longer length of the track. Insert the 100 mm
focal length lens into a holder, and place it 15 cm
from the light source plane. Place the screen on the
side of the lens opposite the light source. Where do
you find a sharp image? Is it where you expect it
using the thin lens equation?
The linear magnification M of a lens is
o
i
h
h
o
i
M
where h
i
is the image height, and h
o
is the object height. Use a ruler to measure the
height of the image and object. Does the linear magnification you observe match the
prediction?
Sample Experiments: Inverse Square Law
This experiment requires a light sensor, interface, and associated software. In this
example we will use Logger Pro software, a Go! Link, and a Vernier Light Sensor.
Position the light source so that the LED is exposed and is facing down the length of
the track. Read the position using the back edge of the carriage for the light source.
Attach a light sensor to the light sensor holder. Insert a Vernier Light Sensor until it
reaches the stop. The location of the sensor can then be read from the arrows on the
base. Position the sensor so it is pointing directly at the light source. Allow the light
source to stabilize for 15 minutes before collecting data. The intensity falls slightly
as the LED warms, so for this experiment, warm-up time is required.
4
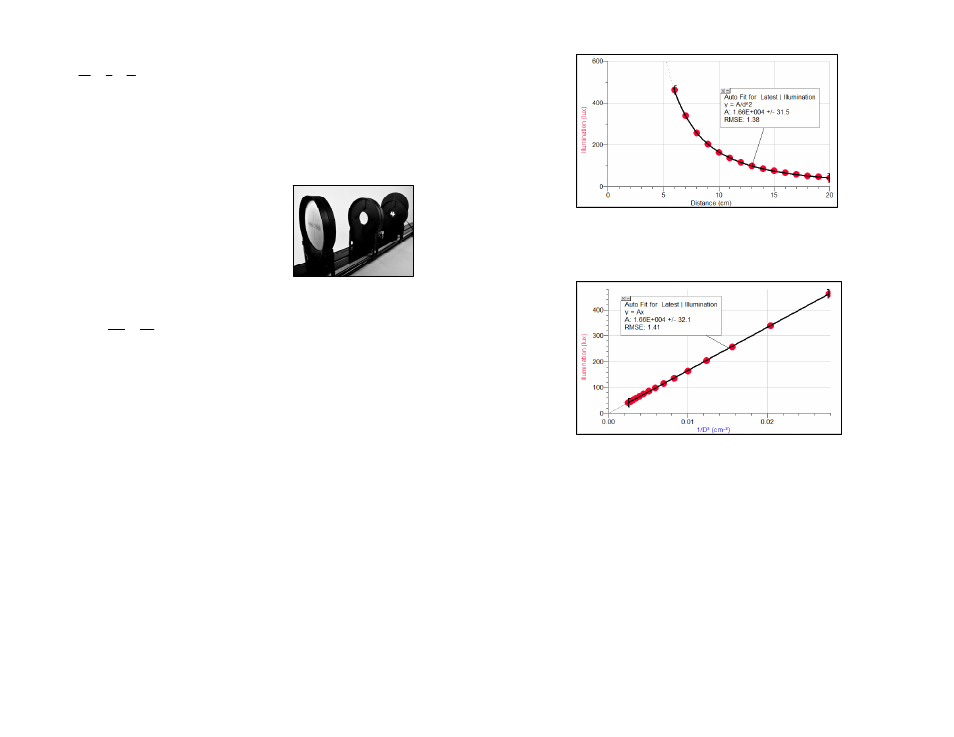
Collect intensity data as a function of distance. Sample data with curve fits are
shown in the following two graphs.
The light intensity follows the expected inverse-square relationship well. Another
way to show this relationship is to graph light intensity vs. the inverse of the squared
distances. The resulting graph should be a direct proportionality. The next graph
shows this result.
The room was partially darkened during data collection. If there is substantial
background light, both graphs would be shifted upward, and the fits would require
an additive term.
Additional Experiments
Make a telescope by combining convex lenses at the sum of focal lengths.
Study the effect of lens size and shape on image formation. Set up the luminous
source, a converging lens, and the screen so that you see a real image on the
screen. Position the aperture plate as close to a lens as possible, and observe the
effect of different size apertures. You may need to dim the room lights to see the
changes. What will happen with the D-shaped opening?
Study depth-of-field by casting a real image of the two slits on the screen, and
then take it out of focus by moving the screen until you can no longer resolve the
two lines. Use the aperture plate to make the working diameter of the lens
smaller. How does this change the image?