EdgeWare FastBreak Standard Version 6.5 User Manual
Page 71
71
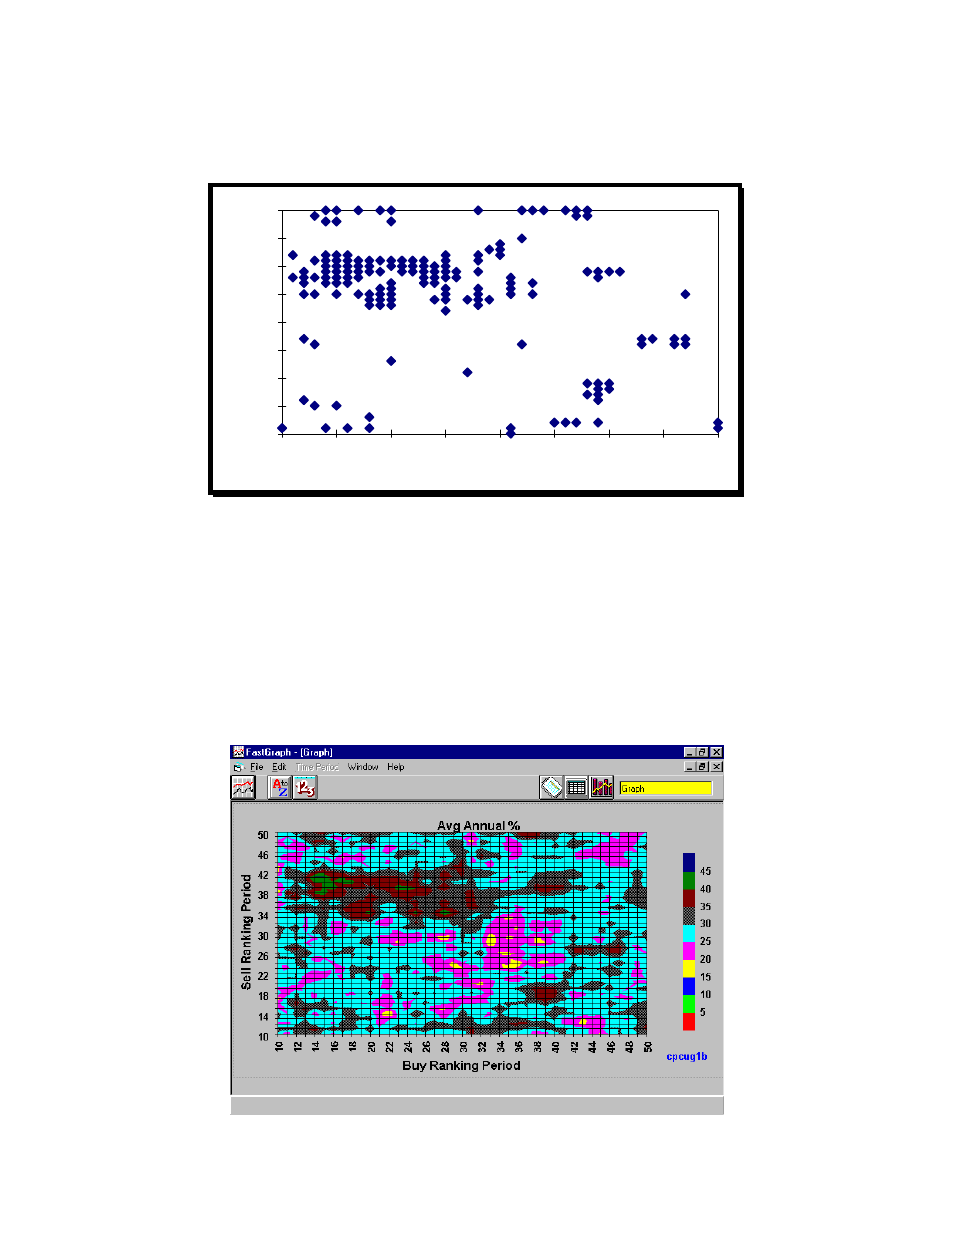
are run, only chart the top 5%-20% of the top best test cases by charting sell ranking and
buy ranking (or AccuTrack parameter 1 and parameter 2) to determine if clusters of
points are formed:
Best 10% of Test Cases
10
15
20
25
30
35
40
45
50
10
15
20
25
30
35
40
45
50
Buy Ranking Period, Days
S
e
ll
R
a
n
k
in
g
P
e
ri
o
d
,
D
a
y
s
Clusters of points are centered about a band from 14/40 through 25/40 day ranking peri-
ods as well as a smaller cluster at 19/35 day ranking periods. These would be areas for
additional analysis (draw down, switches per year etc.). Avoid points that are isolated
such as 20/25, even though this combination of parameters may have given the highest
annual return.
If you have access to a plotting package that can make contour plots, you can take all the
data produced, in this case 1524 test cases, and make the following chart: