Comparison of meter to laboratory results, B. healthcare professional results – Bayer HealthCare Ascensia BREEZE and Ascensia AUTODISCTM Unique 10-Test Disc User Manual
Page 42
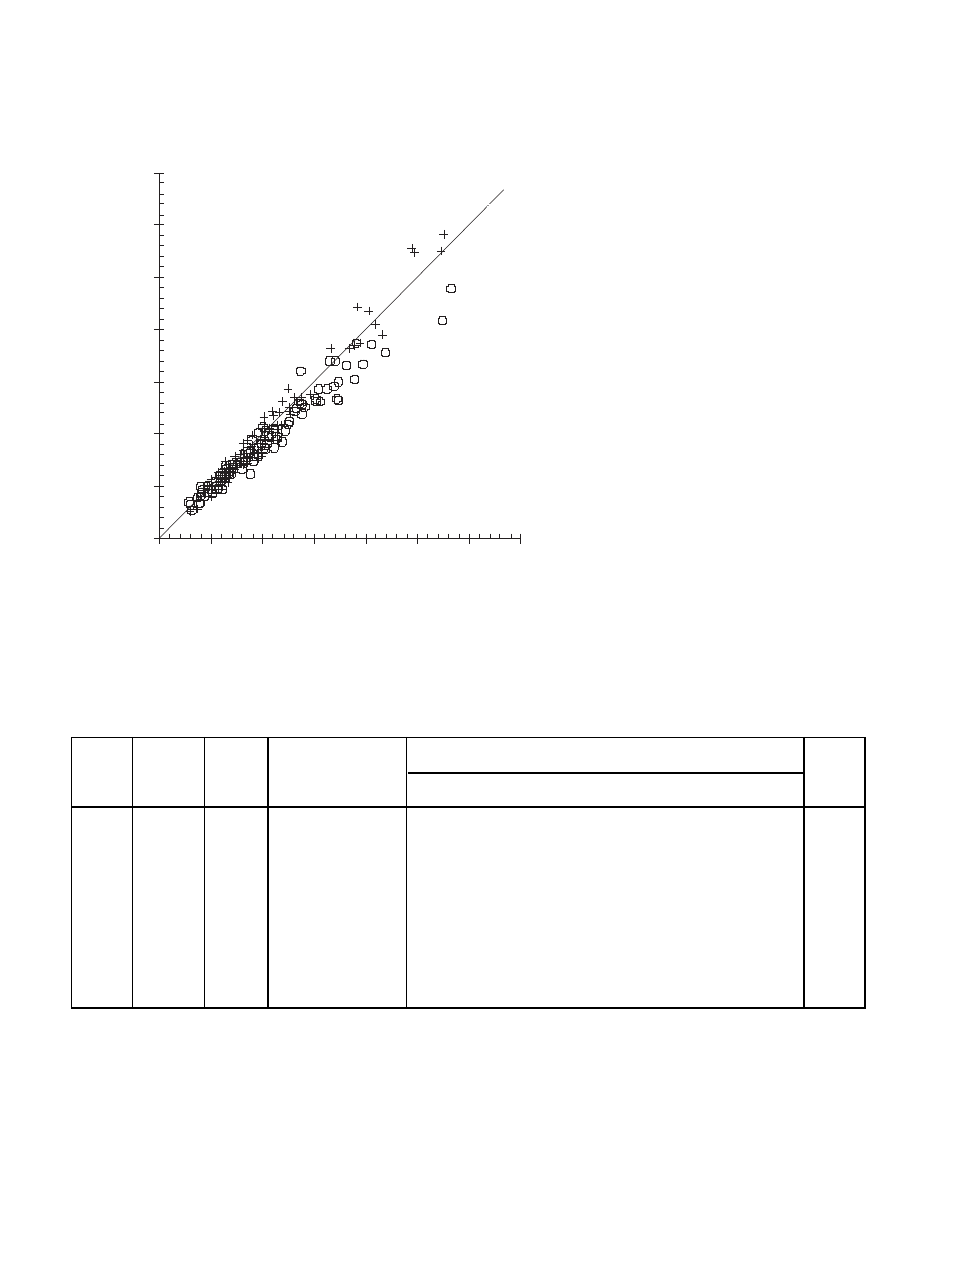
Comparison of Meter to Laboratory Results
†
† Weighted Deming regression, weighted linear correlation coefficient
Opr. = Operator; Lay = Lay User; HCP = Healthcare Professional
36
0.0
5.0
10.0
15.0
20.0
25.0
30.0
35.0
0.0
5.0
10.0 15.0 20.0 25.0 30.0 35.0
Laboratory Plasma Glucose Result (
mmol/L)
Ascensia
®
B
REEZE
™ Result (mmol/L)
o = Lot A
+ = Lot B
y=x
95% Confidence Intervals
Lot
Opr.
N
Y=
Slope
/
Intercept
R
A
Lay
100
0.85x + 0.72
0.81
to
0.89
0.38
to
1.06
0.98
HCP
100
0.84x + 0.65
0.80
to
0.88
0.33
to
0.96
0.98
B
Lay
96
1.02x – 0.58
0.96
to
1.08
–1.04
to
–0.13
0.97
HCP
96
1.03x – 0.61
0.99
to
1.08
–0.94
to
–0.29
0.98
A&B
All
392
0.91x + 0.21
0.89
to
0.94
0.01
to
0.40
0.97
B. Healthcare Professional Results