Kestrel – Kestrel 4300 (Construction) User Manual
Page 4
Kestrel
®
4300 Construction Weather Tracker
7
NAVIGATION
Measurements use and
Wind Speed
Temperature
Wind Chill
Humidity
Evaporation Rate
Heat Index
Dew Point
Wet Bulb
Barometric Pressure
Altitude
Density Altitude
Modos utilizar y
Navegar por los gráficos
El Kestrel 4300 es capaz de almacenar hasta 1800 puntos de referencia para cada medición. Para revisar los datos, pulse el
botón - mientras está viendo un gráfico. Aparece un cursor en el punto de referencia más reciente. Pulse los botones
y para desplazarse entre los puntos de referencia. La fecha y la hora en las cuales se almacenaron los datos se
mostrarán en la parte inferior de la pantalla, y el valor de los datos se mostrará en la parte superior. Mantenga pulsado el
botón o para desplazarse con rapidez por los puntos de referencia.
Pulse el botón
o
para revisar los datos de las otras mediciones. Por favor, tenga en cuenta que el cursor seguirá en
la misma fecha y hora. Si se almacenan nuevos datos mientras se están visualizando los datos del gráfico, todo el gráfico se
desplazará hacia la izquierda y el nuevo punto de referencia se verá reflejado en la parte derecha. El cursor no se moverá
con el gráfico.
Pulse el botón para volver al Modo Gráfico.
The Kestrel 4300 is set up to display 11 Measurements (some are
calculations) in 3 Modes.
The Measurements are listed here with their corresponding screen
icon. In addition to these Measurements and Modes, there are also 3
User Screens, which simultaneously show 3 current measurements,
and the Date & Time Screen, which gives the current date and
time. Use the and buttons to scroll through the various
Measurements, followed by the 3 User Screens and the Date/Time
Screen. Any of these screens can be turned off so that you can
customize your Kestrel Meter to show the screens that your application
requires. (See the Measurements section in the Main Menu.)
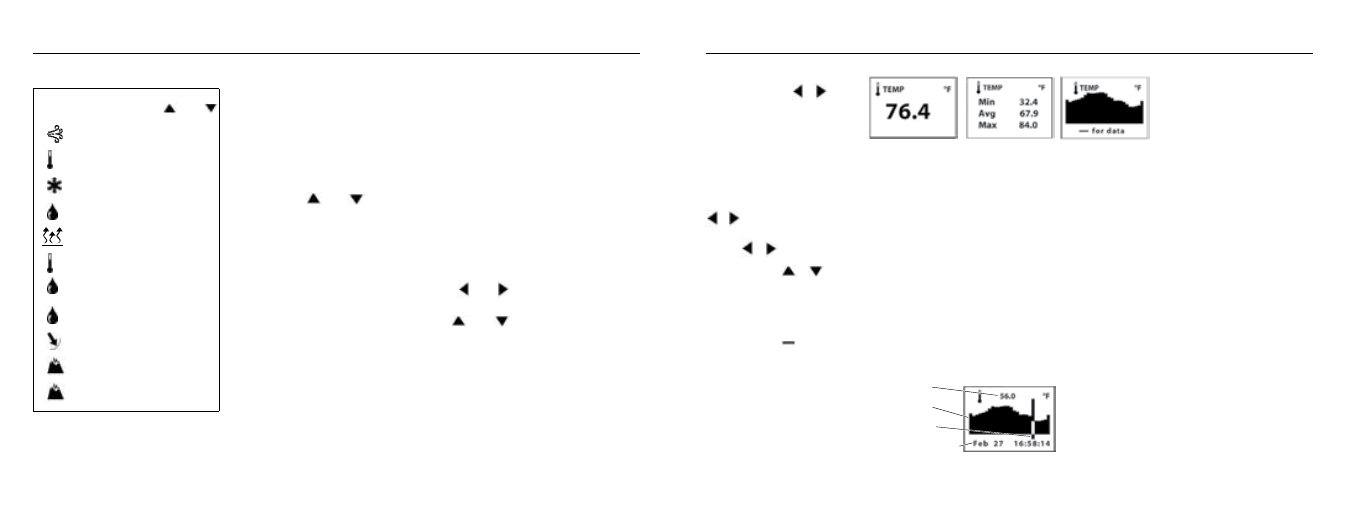
The Modes are displayed below. Use the and buttons to scroll
through the various Modes. From any mode, you may still scroll to a
different Measurement by pressing the and buttons.
Current - Displays the instantaneous reading.
Min/Max/Avg - Displays the Minimum/Maximum/Average readings
from stored data. If there is no stored data, the values will be
displayed as --.-.
Chart - Displays a graphical representation of up to 1800 stored
data points for each measurement. If there is no stored data, the axis
will appear, but the chart will be blank. (See the following section
for information on Chart Navigation.)
D
HI
WB
DP
Valor
Grafico
Cursor
Fecha y hora