Data sheet: powereta, Iqp series –single output quarter brick, Thermal performance – TDK Powereta iQP Series User Manual
Page 8: Thermal measurement location
Data Sheet: Powereta
TM
iQP Series –Single Output Quarter Brick
©2005-2006 TDK Innoveta Inc.
iQP 12V/21A Datasheet 8/3/2006
℡
(877) 498-0099
8/15
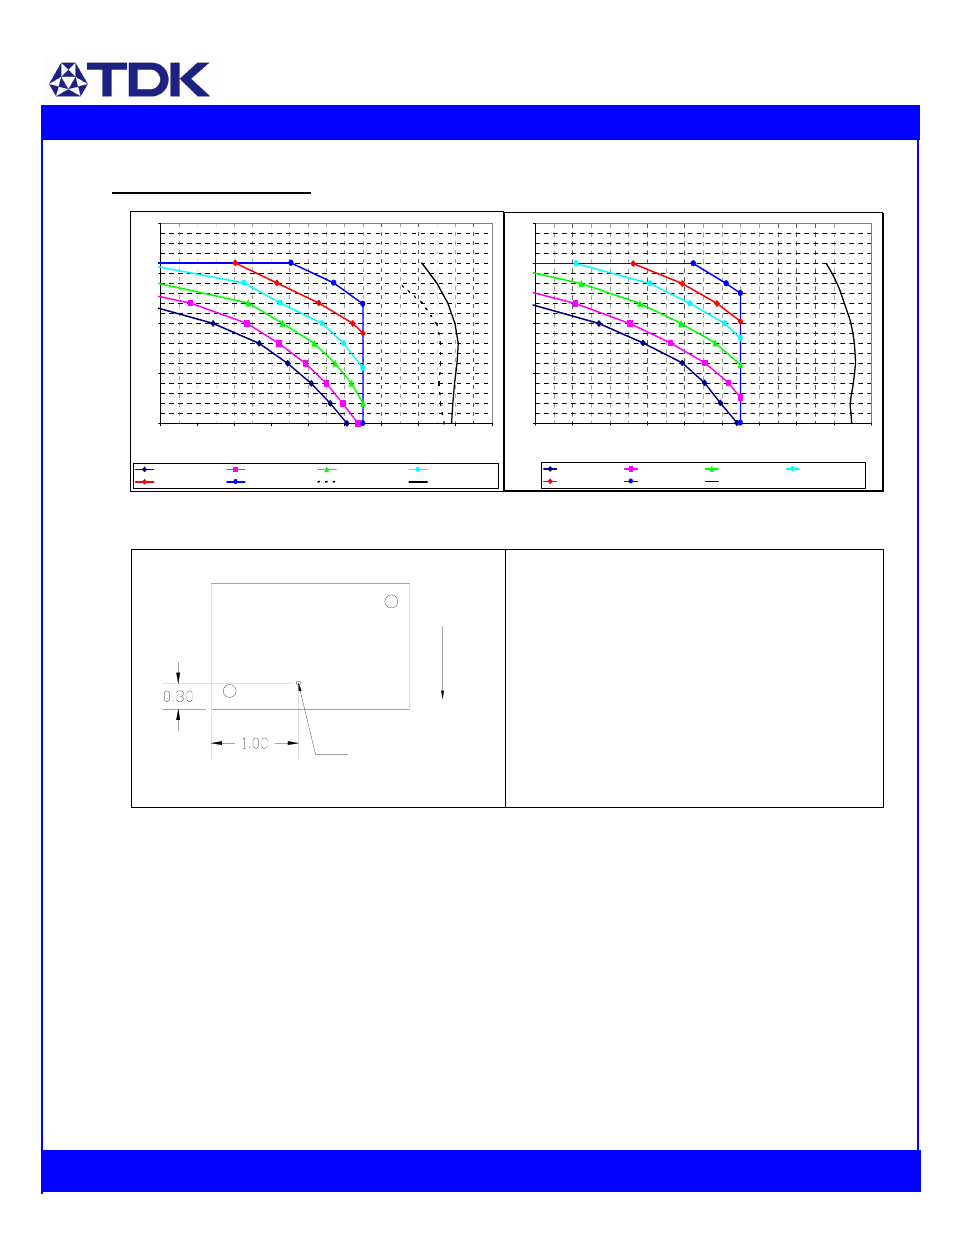
Thermal Performance:
iQP48021A120V-000 through -0x9: 12V, 21A, 252W Output
Maximum output current vs. ambient temperature at nominal
input voltage for airflow rates natural convection (0.3m/s) to
3.0m/s with airflow from pin 3 to pin 1.
Maximum output current vs. ambient temperature at nominal
input voltage for airflow rates natural convection (0.3m/s) to
3.0m/s with airflow from pin 1 to pin 3 (best orientation).
Thermal measurement location – top view
The thermal curves provided are based upon measurements made in TDK Innoveta’s experimental test setup that is described in the
Thermal Management section. Due to the large number of variables in system design, TDK Innoveta recommends that the user verify
the module’s thermal performance in the end application. The critical component should be thermo- coupled and monitored, and
should not exceed the temperature limit specified in the derating curve above. It is critical that the thermocouple be mounted in a
manner that gives direct thermal contact otherwise significant measurement errors may result.
O
u
t
p
u
t
Thermal
measurement
location
I
n
p
u
t
best
orientation
airflow
5
10
15
20
25
30
40
50
60
70
80
90
100
110
120
Ambient Temperature (C)
Ou
tp
ut
C
u
rr
ent
(A
)
NC 0.3 m/s (60 LFM)
0.5 m/s (100 LFM)
1.0 m/s (200 LFM)
1.5 m/s (300 LFM)
2.0 m/s (400 LFM)
3.0 m/s (600 LFM)
Max IMS Temp (<1m/s)
Max IMS Temp (>1m/s)
5
10
15
20
25
30
40
50
60
70
80
90
100
110
120
Ambient Temperature (C)
O
u
tp
u
t C
u
rr
en
t (A
)
NC 0.3 m/s (60 LFM)
0.5 m/s (100 LFM)
1.0 m/s (200 LFM)
1.5 m/s (300 LFM)
2.0 m/s (400 LFM)
3.0 m/s (600 LFM)
Max IMS Temp