Oregon Scientific WMR88 User Manual
Page 8
8
EN
The wind level is shown by a series of icons:
ICON
LEVEL
DESCRIPTION
N/A
<2 miles/h (<4km/h)
Light
2-8 miles/h (3-13 km/h)
Moderate
9-25 miles/h (14-41 km/h)
Strong
26-54 miles/h (42-87 km/h)
Storm
>55 miles/h (>88 km/h)
To view the maximum wind speed and minimum wind
chill readings:
1. Press SELECT to navigate to the Wind Speed / Wind
Direction / Wind Chill Area. will show next to the
Area.
2. Press MAX / MIN to toggle between current / MAX
wind speed and current / MIN wind chill displays.
The timestamp of when maximum wind speed was
recorded is displayed accordingly in the Clock Area.
To clear minimum wind chill reading / maximum wind
speed reading:
1. Press SELECT to navigate to the Wind Speed / Wind
Direction / Wind Chill Area. will show next to the
Area.
2. Press MAX / MIN repeatedly until minimum wind
chill reading or maximum wind speed reading is
displayed.
3. Press and hold MAX / MIN to clear the readings.
NOTE
The wind chill factor is based on the combined
effects of temperature and wind speed. Displayed wind
chill is calculated solely from Channel 1 sensor.
UVI / BAROMETER / RAINFALL
The weather station works with one UV sensor and
one rain gauge. The station is capable of storing and
displaying the hourly history data for the last 10 hours
of UV index, and 24
hours of rainfall and barometric
pressure readings.
UVI
BAROMETER
RAINFALL
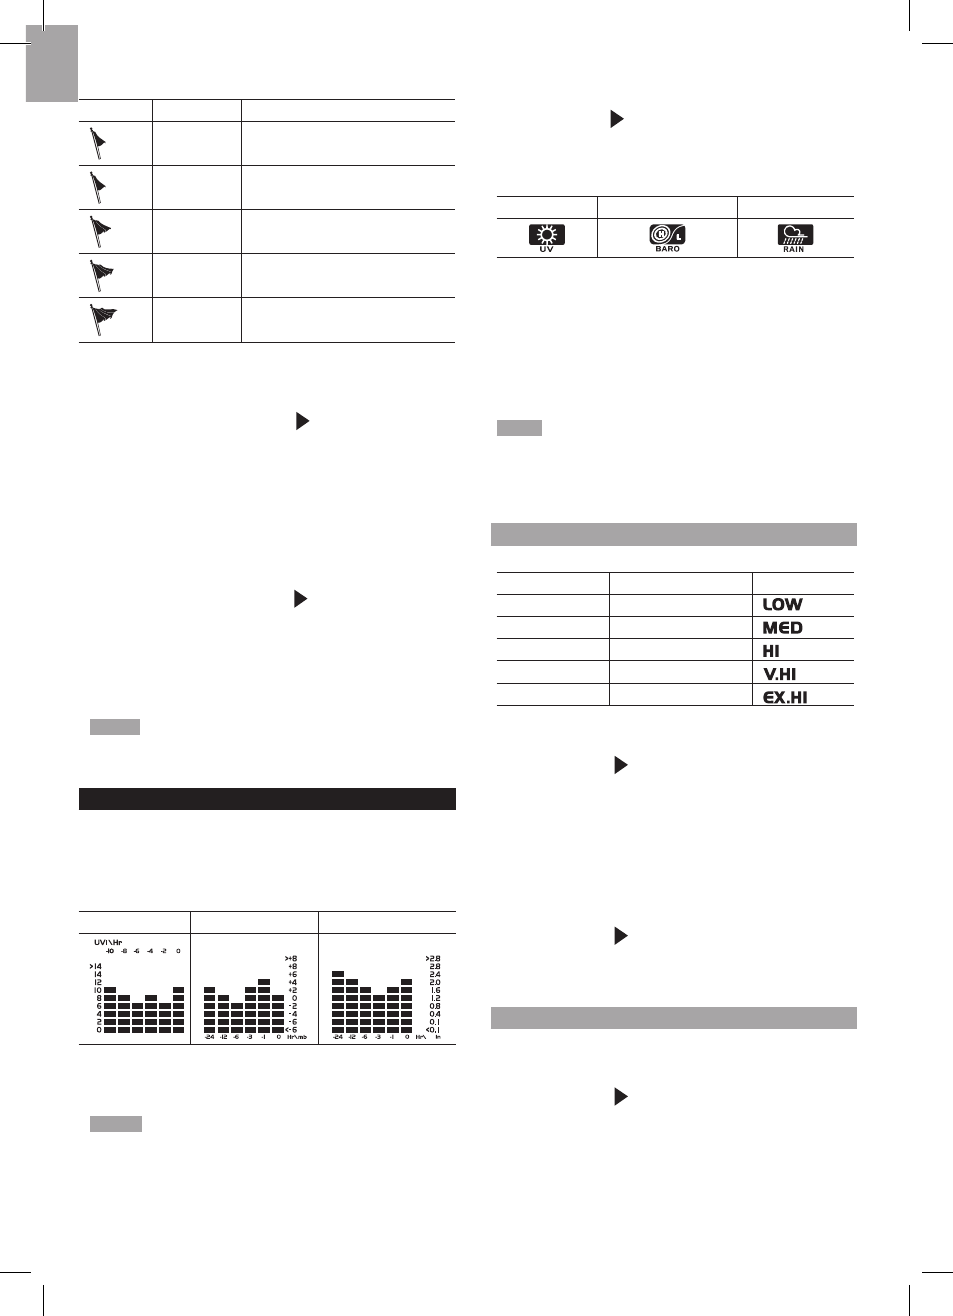
The bar chart display shows the current and historical
data for the UV index, barometric pressure and rainfall
readings.
NOTE The number shown in the horizontal axis (Hr)
indicates how long ago each measurement was taken (e.g.
3 hours ago, 6 hours ago, etc.). The bar represents the
measurement taken for that specific 1 hour period. E.g., if it
is 10:30 pm now, the bar plotted directly above -1 shows the
reading recorded from 9 to 10 pm and -6 shows the reading
recorded earlier in the evening, between 4pm-5pm.
To view the UV / Barometer / Rainfall readings:
1. Press SELECT to navigate to the UV / Barometer /
Rainfall Area. will show next to the Area.
2. Press MODE to toggle between UVI / Barometer
/ Rainfall readings. The corresponding icon will
appear:
UVI
BAROMETER
RAINFALL
To select the measurement unit for the barometer or
rainfall readings:
In the UV / Barometer / Rainfall Area, press UNIT to
switch between:
• Barometer: Millimeters of mercury (mmHg), inches
of mercury (inHg), millibars per hectopascal (mb).
• Rainfall: Millimeters (mm), inches (in), recorded for
that hour.
NOTE As the purpose of the bar graph is only to provide
a quick comparison between the records of the past 24
hours, the vertical axis cannot convert from inches to mm.
Therefore, changing the measurement unit will have no
effect on the bar graph display.
UV INDEX
The UV index levels are as follows:
UV INDEX
DANGER LEVEL
ICON
0-2
Low
3-5
Moderate
6-7
High
8-10
Very high
11 and above
Extremely high
To view the maximum UV reading:
1. Press SELECT to navigate to the UVI / Barometer /
Rainfall Area. will show next to the Area.
2. Press MODE repeatedly to select UV display.
3. Press MAX / MIN to toggle between current / MAX
UV index display.
The timestamp of when maximum UV was recorded is
displayed accordingly in the Clock Area.
To clear maximum UV reading:
1. Press SELECT to navigate to the UVI / Barometer /
Rainfall Area. will show next to the Area.
2. Press MODE repeatedly to select UV display.
3. Press and hold MAX / MIN to clear the readings.
BAROMETER
To set the altitude level compensation for the
Barometer readings:
1. Press SELECT to navigate to the UVI / Barometer /
Rainfall Area. will show next to the Area.
2. Press MODE repeatedly to select Barometric
display.
3. Press and hold MODE to enter the altitude setting.
4. Press UP / DOWN to increase / decrease the setting
value.
5. Press MODE to confirm the setting.