Premier Floors User Manual
Page 54
54
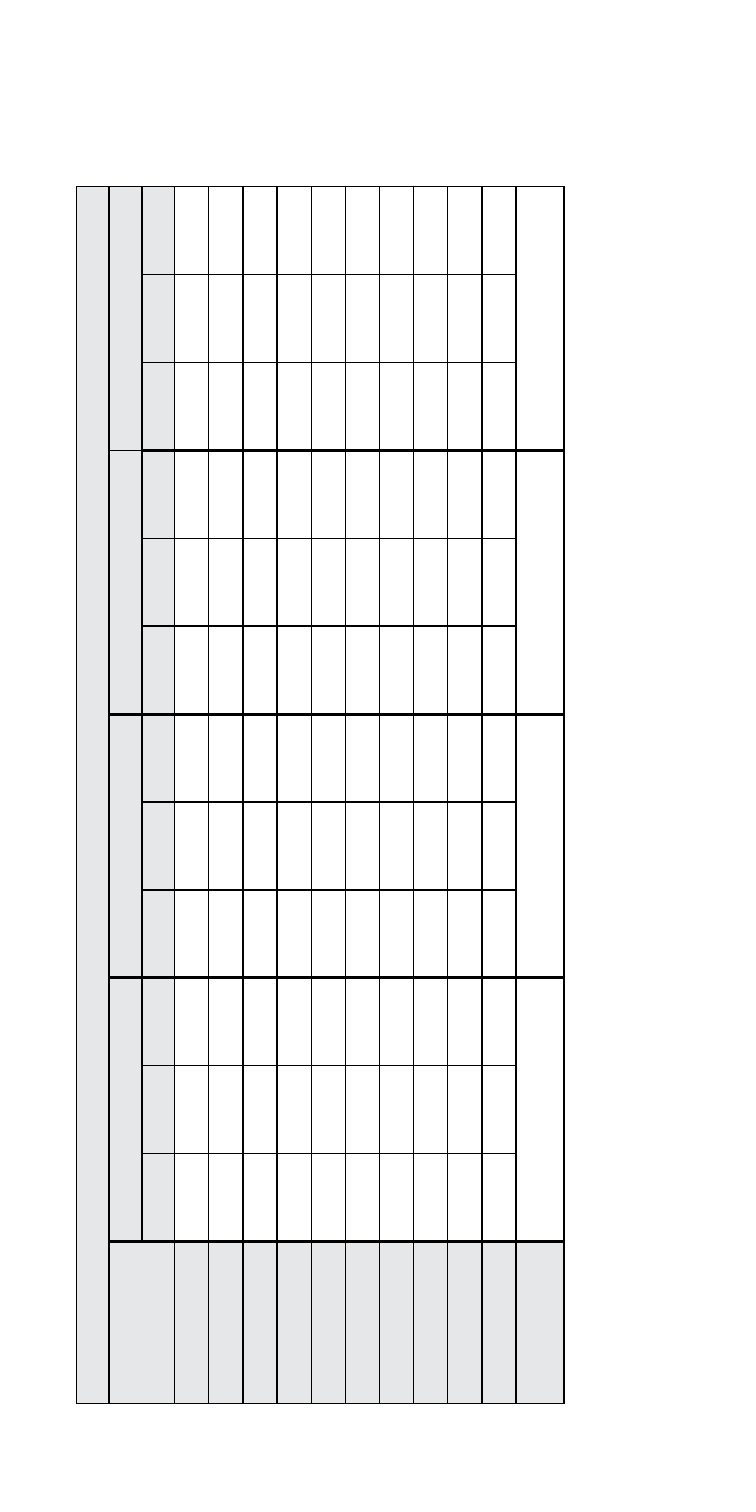
load Chart 12: Wind speed vs.
Pressure (Chart 2 of 2)
W
all
loads (psf) -
end Zone (Zone 5) for 100sf to 500sf effective wind area
Mean Roof
Height (ft)
130 MPH
140 MPH
150 MPH
170 MPH
exp B
exp C
exp
d
exp B
exp C
exp
d
exp B
exp C
exp
d
exp B
exp C
exp
d
15
-31.6
-38.2
-46.5
-36.7
-44.4
-53.9
-42.1
-50.9
-61.9
-54.1
-65.5
-79.5
20
-31.6
-40.8
-49.0
-36.7
-47.3
-56.9
-42.1
-54.3
-65.3
-54.1
-69.8
-83.9
25
-31.6
-42.7
-50.9
-36.7
-49.5
-59.1
-42.1
-56.8
-67.8
-54.1
-73.0
-87.1
30
-31.6
-44.2
-52.5
-36.7
-51.4
-60.9
-42.1
-58.9
-69.9
-54.1
-75.7
-89.8
35
-33.2
-45.8
-53.7
-38.5
-53.2
-62.4
-44.2
-61.1
-71.6
-56.8
-78.4
-92.0
40
-34.4
-47.1
-55.0
-40.0
-54.7
-63.9
-45.9
-62.7
-73.3
-59.0
-80.6
-94.1
45
-35.4
-48.3
-56.2
-41.1
-56.2
-65.3
-47.2
-64.4
-74.9
-60.6
-82.8
-96.3
50
-36.7
-49.3
-57.2
-42.6
-57.3
-66.4
-48.8
-65.7
-76.2
-62.8
-84.4
-97.9
55
-37.6
-50.2
-58.1
-43.7
-58.4
-67.5
-50.1
-66.9
-77.5
-64.4
-86.0
-99.5
60
-38.6
-51.2
-59.1
-44.8
-59.5
-68.6
-51.4
-68.2
-78.7
-66.0
-87.6
-101.2
net
design wind pressure
-31.6
-36.7
-42.1
-54.1
More infor
mation on this char
t can be found in T
echnical Bulletin #15 (www
.pbssips.com).